Dashboard Overview
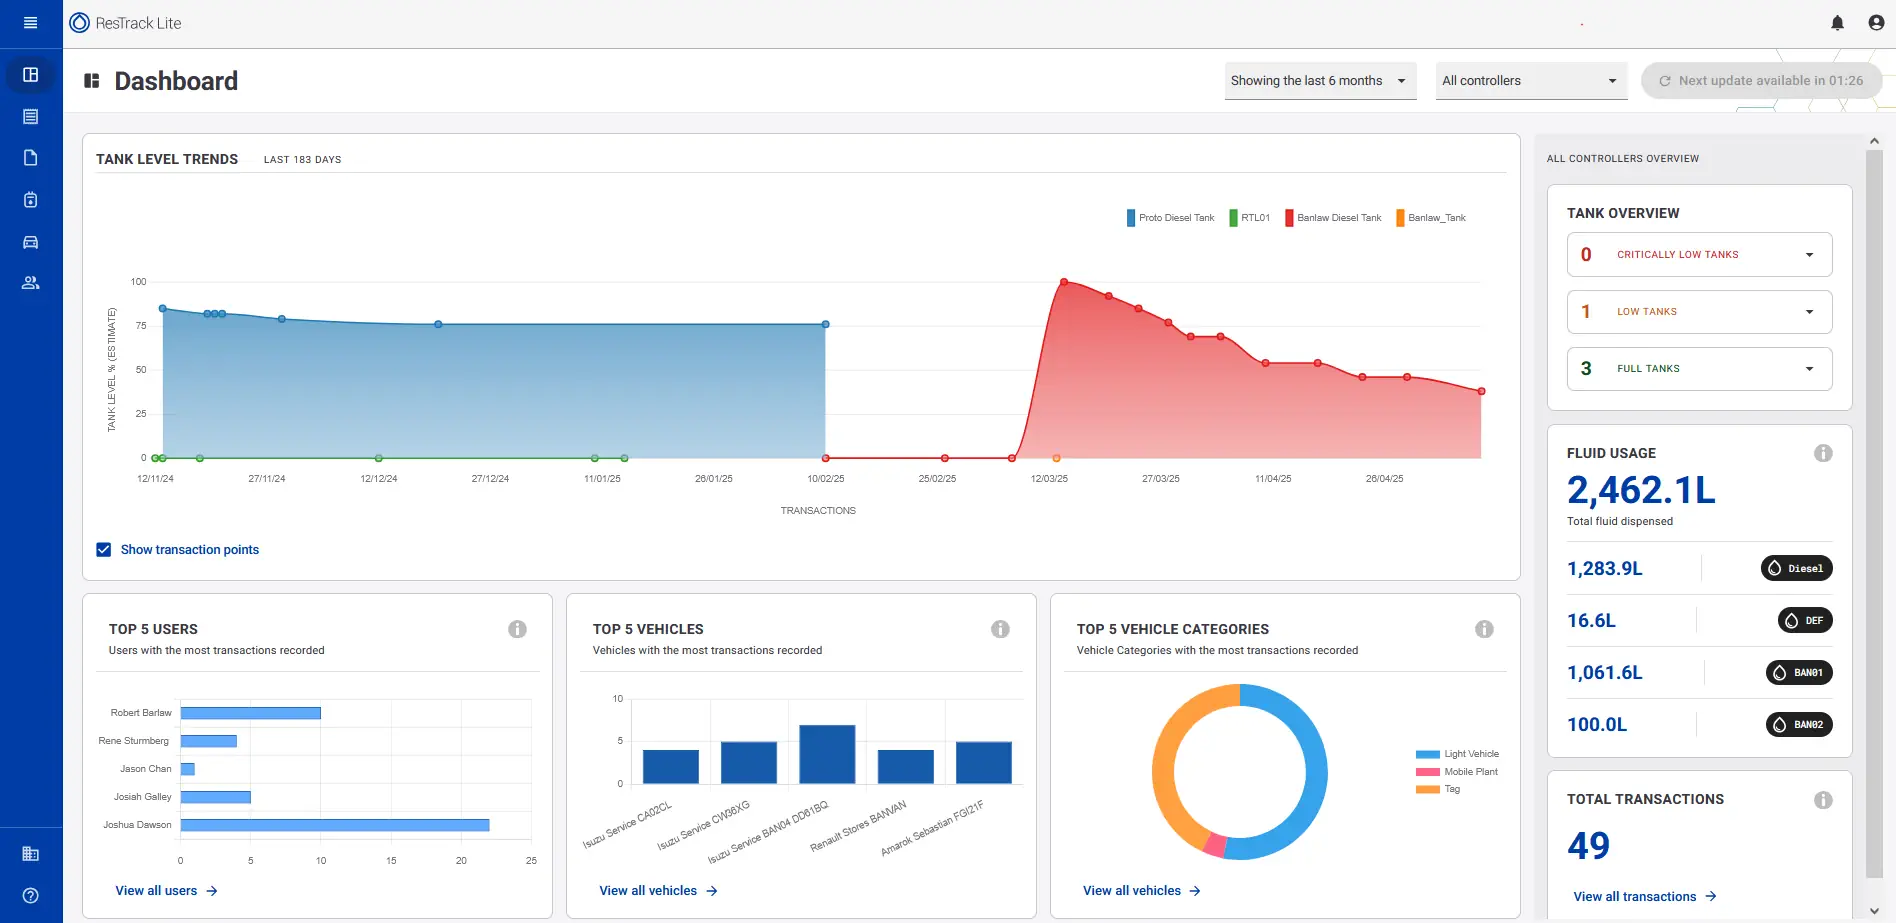
The Dashboard provides a comprehensive, real-time overview of tank levels, fluid usage, and transaction activity across all connected controllers. Its primary purpose is to offer users a quick and intuitive snapshot of operational fuel data, helping identify trends, monitor usage, and track performance. Key visualizations include tank level trends over time, top users and vehicles by transaction volume, vehicle category breakdowns, and a summary of fluid usage by type. Alerts for low or critically low tanks are clearly displayed to prompt timely refueling or investigation. This centralized view enables efficient decision-making and streamlined fuel management across operations.
Hover over the highlighted areas in the dashboard below to learn more about each widget and its purpose:
The Tank Level Trends chart includes several interactive features that help you focus on specific tanks and investigate fuel activity.
Show or hide tanks
Use the legend in the top-right corner of the chart to control which tanks are displayed.
Selecting a tank name removes it from the chart, making it easier to compare individual tanks or focus on a specific fuel system. Select the tank name again to display it.
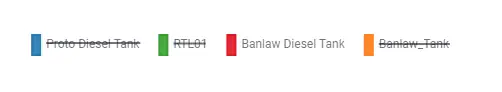
Show or hide individual tanks
Show or hide transaction points
Transaction points are displayed by default to indicate where fuel dispensing and delivery events have occurred.
Clear the Show transaction points checkbox to hide these markers and display only the tank level trend.
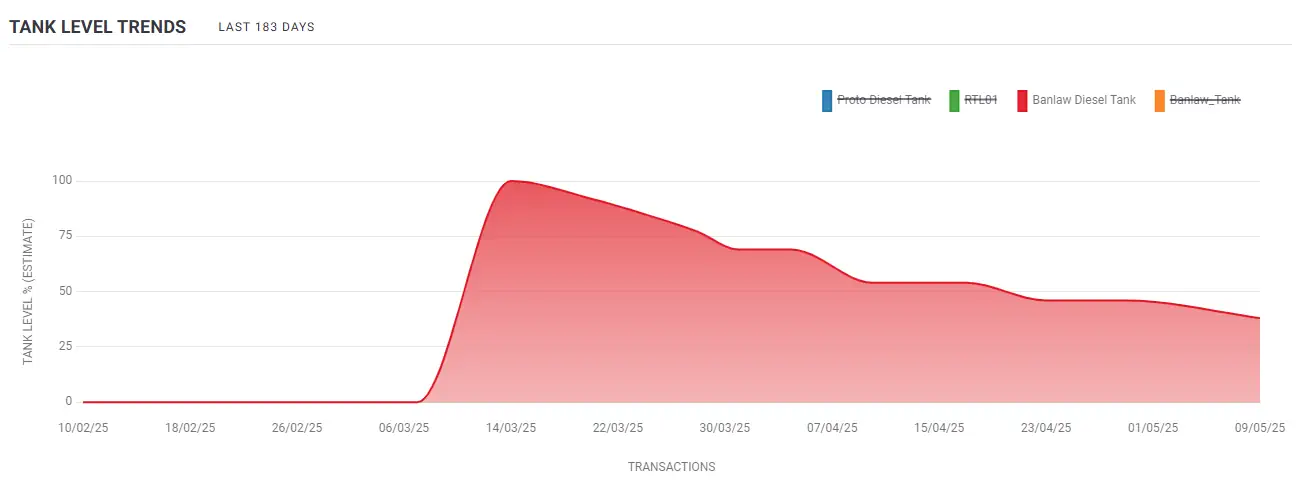
Display only the tank level trend
View transaction details
Hover over any transaction point to display additional information, including the transaction date, time, fuel volume, and recorded tank level.
This allows you to investigate individual fuel dispensing or delivery events directly from the dashboard.
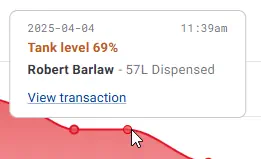
View transaction details